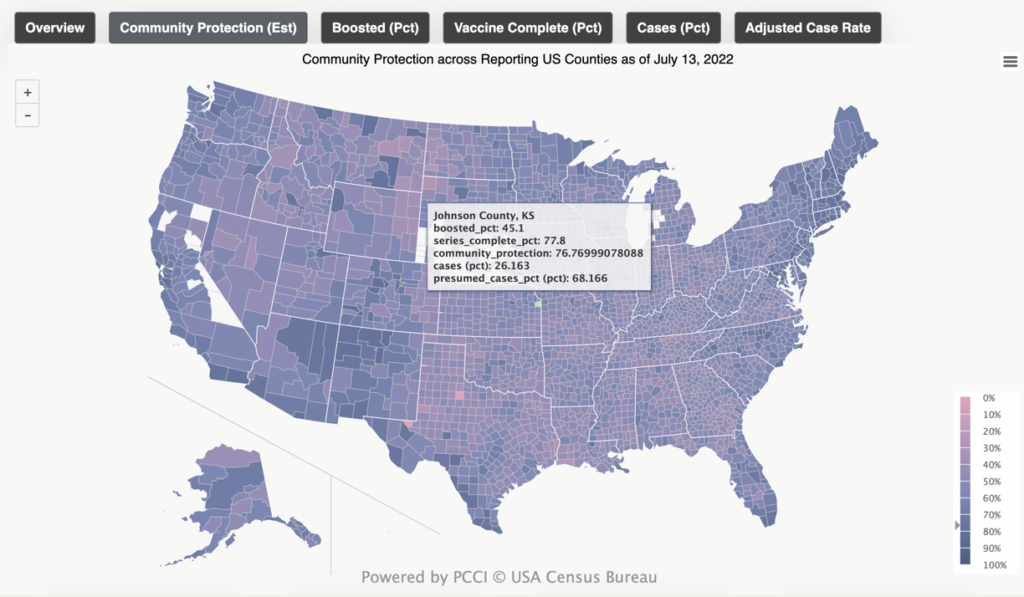
The Community Protection Dashboard was developed by Parkland Center for Health Innovation (PCCI) and informed by a joint effort between the Institute for Healthcare Improvement, Civitas Networks for Heatlh, Cincinnati Children’s Hospital, and PCCI. It highlights the recent level of community protection from COVID-19 as well as provides insights into contributing factors. It is built from antibody prevalence surveillance, case reports, and counts of people with vaccinations series and boosters within a community. The aggregate Community Protection Index provides an overall score combining multiple factors and data sources accounting for the most recent dominant Covid-19 variant characteristics and vaccine and natural immunity effectiveness modeled with time-based variables and waning immunity factors. The current national Community Protection Index average is 51.6 and the scores nationally range from 41 to 83. The goal of the analytics within the dashboard is to contextualize what it’s being observed locally to what is happening concurrently across surrounding counties, state and nation. We intend for these insights to help provide a local dynamic vulnerability awareness with a national contextualization and use it to help identify emerging trends and forecast impact based on cross –region comparisons. Local cross-county/region collaboration and communication can also be enhanced with these additional insights.

| Cookie | Duration | Description |
|---|---|---|
| cookielawinfo-checkbox-analytics | 11 months | This cookie is set by GDPR Cookie Consent plugin. The cookie is used to store the user consent for the cookies in the category "Analytics". |
| cookielawinfo-checkbox-functional | 11 months | The cookie is set by GDPR cookie consent to record the user consent for the cookies in the category "Functional". |
| cookielawinfo-checkbox-necessary | 11 months | This cookie is set by GDPR Cookie Consent plugin. The cookies is used to store the user consent for the cookies in the category "Necessary". |
| cookielawinfo-checkbox-others | 11 months | This cookie is set by GDPR Cookie Consent plugin. The cookie is used to store the user consent for the cookies in the category "Other. |
| cookielawinfo-checkbox-performance | 11 months | This cookie is set by GDPR Cookie Consent plugin. The cookie is used to store the user consent for the cookies in the category "Performance". |
| viewed_cookie_policy | 11 months | The cookie is set by the GDPR Cookie Consent plugin and is used to store whether or not user has consented to the use of cookies. It does not store any personal data. |